
Question
How can I monitor performance and detect bottlenecks while using the FineReader Server 14?
Answer
You can monitor all of your system hardware and detect bottlenecks using the Performance Monitor:
- Open the Performance Monitor (go to Start, in the Search box, type perfmon, and then choose the related link)
- Create Data Collector Set from template attached below:
-
In the navigation pane, expand Data Collector Sets, right-click User-defined, choose New, and then choose Data Collector Set:
-
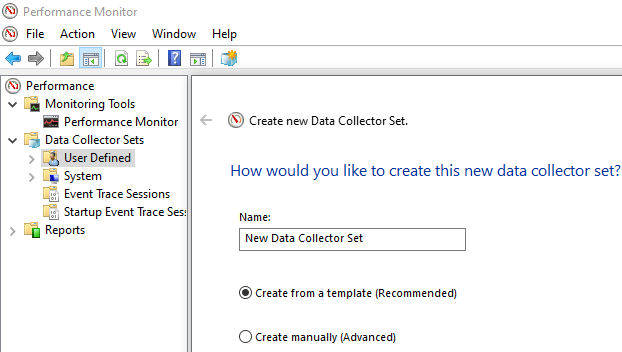
In the Create new Data Collector Set wizard page, enter a name for the new data collector set
-
Select Create from a template (Recommended), and then choose the Next button
- Download attached file: FineReader Server 14 Data Collector Set.xml
-
On the Which template would you like to use page, choose the Browse button, locate the .XML file attached, and then choose the Open button.Note: In this template 5 OCRProcessor.exe processes are used. Please, correct the count of processes according to your system.
-
Choose the Next button, and then follow the instructions to finish creating the data collector set.
-
-
Follow the diagnostic routines from the article: Monitoring the system and identifying bottlenecks