
Question
How to collect and save HAR logs for diagnostics purposes?
Answer
Google Chrome
The following steps show how to use the developer tools in Google Chrome. For more information, see Chrome DevTools.
-
Start recording the steps to reproduce the issue.
How to capture Reproduction Steps on Windows using Steps Recorder
How to capture Reproduction Steps on Mac -
Navigate to the step just prior to where the issue occurs.
-
Press F12 to launch the developer tools. You can also launch the tools from the toolbar menu under More tools > Developer tools.
-
By default, the browser keeps trace information only for the page that's currently loaded. Set the following options so the browser keeps all trace information, even if your repro steps require going to more than one page:
-
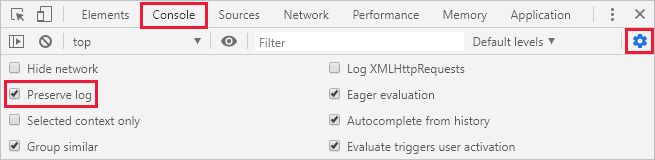
Select the Console tab, select Console settings, then select Preserve Log.
-
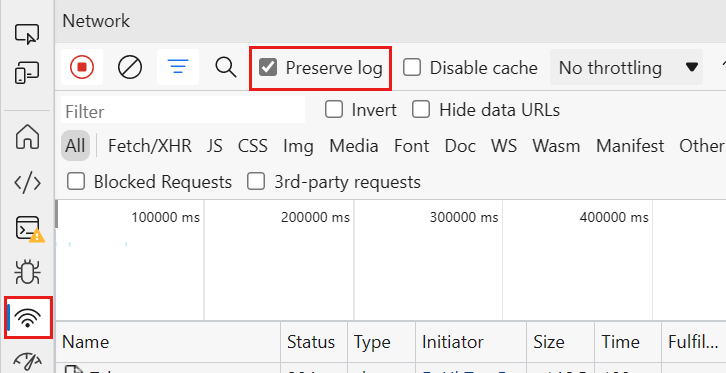
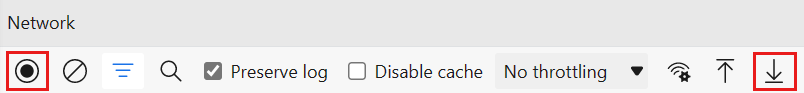
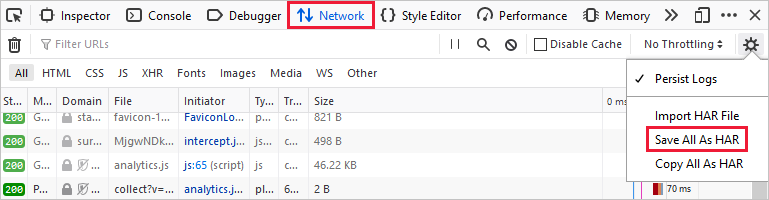
Select the Network tab, then select Preserve log.

-
-
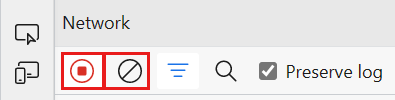
On the Network tab, select Stop recording network log and Clear.

-
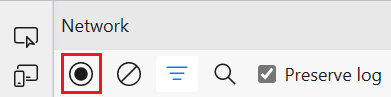
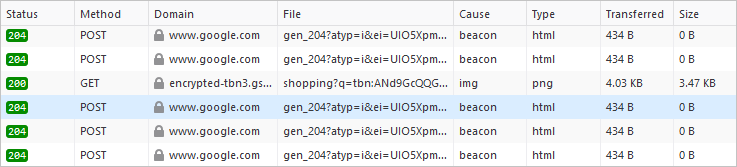
Select Record network log, then reproduce the issue.

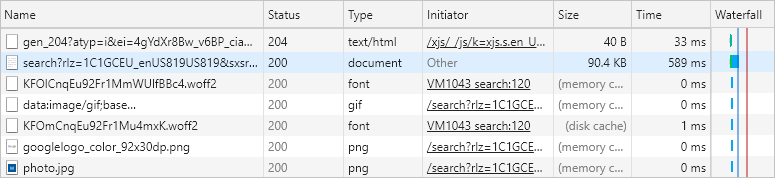
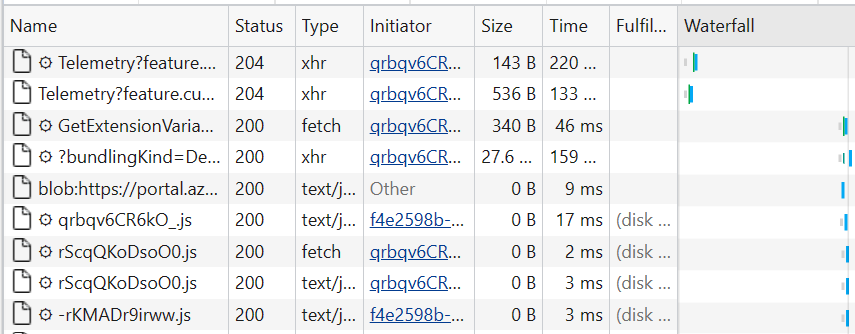
You'll see session output similar to the following image.
-
After you have reproduced the issue, select Stop recording network log, then select Export HAR and save the file.

-
Stop the Steps Recorder and save the recording.
-
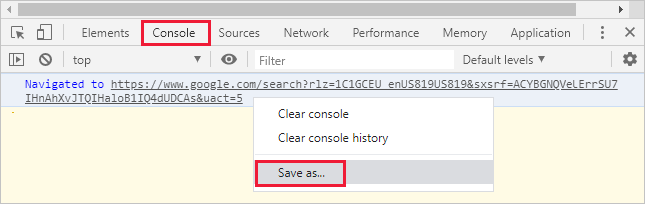
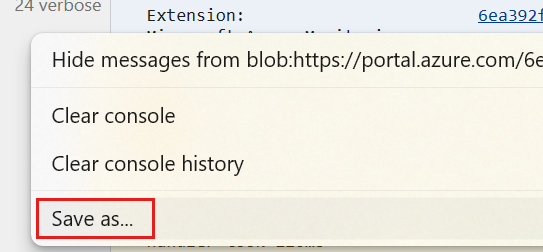
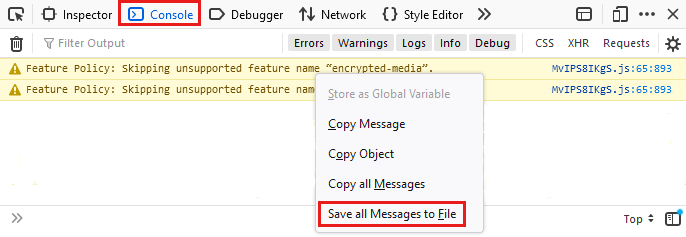
Back in the browser developer tools pane, select the Console tab. Right-click one of the messages, then select Save as..., and save the console output to a text file.
-
Package the browser trace HAR file, console output, and screen recording files in a compressed format such as .zip.
Microsoft Edge
The following steps show how to use the developer tools in Microsoft Edge. For more information, see Microsoft Edge DevTools.
-
Start recording the steps to reproduce the issue using Steps Recorder.
How to capture Reproduction Steps on Windows using Steps Recorder -
Navigate to the step just prior to where the issue occurs.
-
Press F12 to launch Microsoft Edge DevTools. You can also launch the tools from the toolbar menu under More tools > Developer tools.
-
By default, the browser keeps trace information only for the page that's currently loaded. Set the following options so the browser keeps all trace information, even if your reproduction steps require going to more than one page.
-
Select the Console tab, select Console settings, then select Preserve Log.
-
Select the Network tab. If that tab isn't visible, click the More tools (+) button and select Network. Then, from the Network tab, select Preserve log.
-
-
On the Network tab, select Stop recording network log and Clear.
-
Select Record network log, then reproduce the issue.
You'll see session output similar to the following image.
-
After you have reproduced the issue, select Stop recording network log, then select Export HAR and save the file.
-
Stop the Steps Recorder and save the recording.
-
Back in the browser developer tools pane, select the Console tab. Right-click one of the messages, then select Save as..., and save the console output to a text file.
-
Package the browser trace HAR file, console output, and screen recording files in a compressed format such as .zip.
Mozilla Firefox
The following steps show how to use the developer tools in Firefox. For more information, see Firefox Developer Tools.
-
Start recording the steps to reproduce the issue.
How to capture Reproduction Steps on Windows using Steps Recorder
How to capture Reproduction Steps on Mac -
Navigate to the step prior to where the issue occurs.
-
Press F12 to launch the developer tools. You can also launch the tools from the toolbar menu under More tools > Web developer tools.
-
By default, the browser keeps trace information only for the page that's currently loaded. Set the following options so the browser keeps all trace information, even if your repro steps require going to more than one page:
-
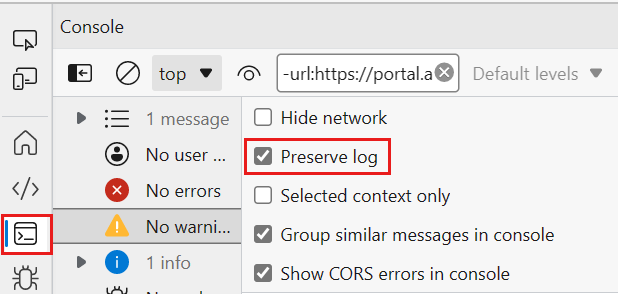
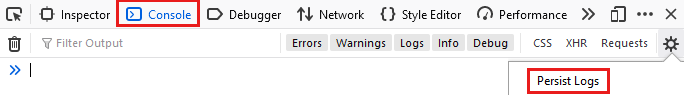
Select the Console tab, select the Settings icon, and then select Persist Logs.
-
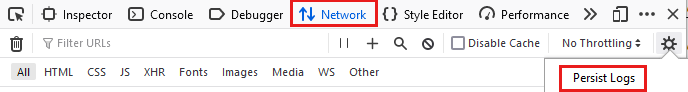
Select the Network tab, select the Settings icon, and then select Persist Logs.
-
-
On the Network tab, select Clear.

-
Reproduce the issue. You'll see session output similar to the following image.
-
After you have reproduced the issue, select Save All As HAR.
-
Stop the Steps Recorder on Windows or the screen recording on Mac, and save the recording.
-
Back in the browser developer tools pane, select the Console tab. Right-click one of the messages, then select Save All Messages to File, and save the console output to a text file.
-
Package the browser trace HAR file, console output, and screen recording files in a compressed format such as .zip.
Apple Safari
The following steps show how to use the developer tools in Apple Safari on Mac. For more information, see Safari Developer Tools overview.
-
Enable the developer tools in Safari:
-
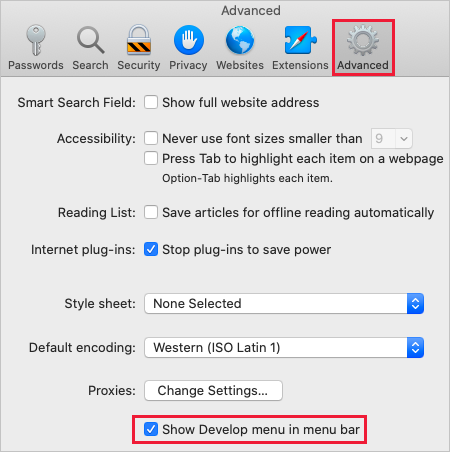
Select Safari, then select Preferences.
-
Select the Advanced tab, then select Show Develop menu in menu bar.
-
-
Start recording the steps to reproduce the issue.
How to capture Reproduction Steps on Mac -
Navigate to the step prior to where the issue occurs.
-
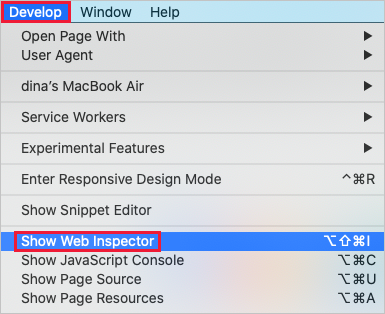
Select Develop, then select Show Web Inspector.
-
By default, the browser keeps trace information only for the page that's currently loaded. Set the following options so the browser keeps all trace information, even if your repro steps require going to more than one page:
-
Select the Console tab, then select Preserve Log.

-
Select the Network tab, then select Preserve Log.

-
-
On the Network tab, select Clear Network Items.

-
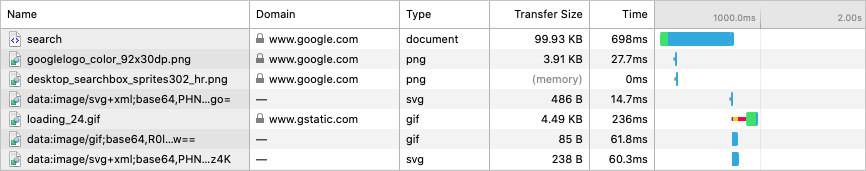
Reproduce the issue. You'll see session output similar to the following image.
-
After you have reproduced the issue, select Export and save the file.

-
Stop the screen recorder, and save the recording.
-
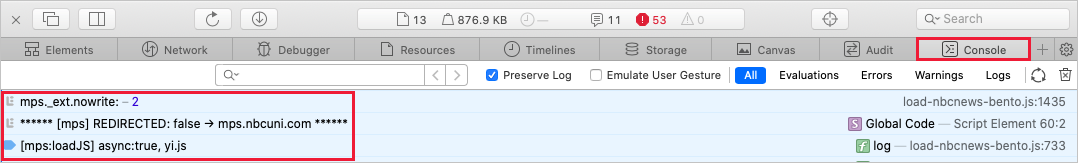
Back in the browser developer tools pane, select the Console tab, and expand the window. Place your cursor at the start of the console output then drag and select the entire contents of the output. Use Command-C to copy the output and save it to a text file.
-
Package the browser trace HAR file, console output, and screen recording files in a compressed format such as .zip.